用R进行一阶验证性因素分析
来自OBHRM百科
Lichaoping(讨论 | 贡献)2021年8月7日 (六) 19:33的版本
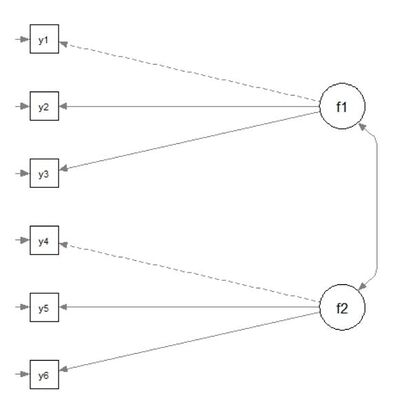
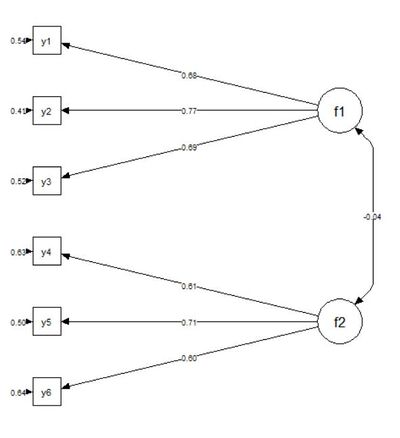
示意图
脚本与注释
library(lavaan)                                                          # 调用lavaan包,如果没有安装,需要先安装
cfadata <- read.table("http://www.obhrm.net/data/ex5.1.dat")             # 读取数据文件到cfadata,cfadata是自己命名,可以随便定
names(cfadata) <-c(paste("y", 1:6, sep=""))                              # 给变量命名
cfamodel <- ' f1 =~ y1 +y2 +y3                                           # 设置模型,cfamodel还是自己命名
              f2 =~ y4 +y5 +y6 '
cfafit <- cfa(cfamodel, cfadata)                                         # 进行CFA,cfafit为自己的命名,方便后面调用
summary(cfafit,fit.measures="TRUE")                                      # 显示CFA的总体结果
fitMeasures(cfafit,fit.measures="all", baseline.model=NULL)              # 显示所有拟合指数
standardizedSolution(cfafit)                                             # 显示标准化的结果
library(semTools)                                                        # 调用semTools包,如果没有安装,需要先安装
reliability(cfafit)                                                      # 计算AVE、CR(Composite Reliability)等值
library(semPlot)                                                         # 调用semPlot包来画图,如果没有安装,需要先安装
semPaths(cfafit,whatLabels="std", intercepts=FALSE, style="lisrel",
                       nCharNodes=0,
                       nCharEdges=0,
                       curveAdjacent = TRUE,title=F, layout="tree2",curvePivot=TRUE,
                       rotation=4,fixedStyle = c("black",1),freeStyle = c("black",1))#  画图函数
结果
> summary(cfafit,fit.measures="TRUE")                                               # 显示CFA的结果
lavaan (0.5-23.1097) converged normally after  34 iterations

  Number of observations                           500

  Estimator                                         ML
  Minimum Function Test Statistic                3.896
  Degrees of freedom                                 8
  P-value (Chi-square)                           0.866

Model test baseline model:

  Minimum Function Test Statistic              596.921
  Degrees of freedom                                15
  P-value                                        0.000

User model versus baseline model:

  Comparative Fit Index (CFI)                    1.000
  Tucker-Lewis Index (TLI)                       1.013

Loglikelihood and Information Criteria:

  Loglikelihood user model (H0)              -4906.609
  Loglikelihood unrestricted model (H1)      -4904.661

  Number of free parameters                         13
  Akaike (AIC)                                9839.218
  Bayesian (BIC)                              9894.007
  Sample-size adjusted Bayesian (BIC)         9852.745

Root Mean Square Error of Approximation:

  RMSEA                                          0.000
  90 Percent Confidence Interval          0.000  0.027
  P-value RMSEA <= 0.05                          0.995

Standardized Root Mean Square Residual:

  SRMR                                           0.016

Parameter Estimates:

  Information                                 Expected
  Standard Errors                             Standard

Latent Variables:
                   Estimate  Std.Err  z-value  P(>|z|)
  f1 =~
    V1                1.000
    V2                1.127    0.099   11.378    0.000
    V3                1.020    0.089   11.474    0.000
  f2 =~
    V4                1.000
    V5                1.058    0.129    8.226    0.000
    V6                0.897    0.105    8.524    0.000

Covariances:
                   Estimate  Std.Err  z-value  P(>|z|)
  f1 ~~
    f2               -0.030    0.052   -0.583    0.560

Variances:
                   Estimate  Std.Err  z-value  P(>|z|)
   .V1                1.064    0.096   11.124    0.000
   .V2                0.798    0.100    7.981    0.000
   .V3                1.010    0.095   10.600    0.000
   .V4                1.290    0.119   10.880    0.000
   .V5                0.854    0.110    7.736    0.000
   .V6                1.066    0.097   11.035    0.000
    f1                0.907    0.125    7.254    0.000
    f2                0.761    0.133    5.740    0.000

> fitMeasures(cfafit,fit.measures="all", baseline.model=NULL) # 显示所有拟合指数
               npar                fmin               chisq                  df              pvalue
             13.000               0.004               3.896               8.000               0.866
     baseline.chisq         baseline.df     baseline.pvalue                 cfi                 tli
            596.921              15.000               0.000               1.000               1.013
               nnfi                 rfi                 nfi                pnfi                 ifi
              1.013               0.988               0.993               0.530               1.007
                rni                logl   unrestricted.logl                 aic                 bic
              1.007           -4906.609           -4904.661            9839.218            9894.007
             ntotal                bic2               rmsea      rmsea.ci.lower      rmsea.ci.upper
            500.000            9852.745               0.000               0.000               0.027
       rmsea.pvalue                 rmr          rmr_nomean                srmr        srmr_bentler
              0.995               0.029               0.029               0.016               0.016
srmr_bentler_nomean         srmr_bollen  srmr_bollen_nomean          srmr_mplus   srmr_mplus_nomean
              0.016               0.016               0.016               0.016               0.016
              cn_05               cn_01                 gfi                agfi                pgfi
           1991.316            2579.520               0.997               0.993               0.380
                mfi                ecvi
              1.004               0.060
> standardizedSolution(cfafit)                                                   # 显示标准化的结果
   lhs op rhs est.std    se      z pvalue
1   f1 =~  V1   0.678 0.035 19.348  0.000
2   f1 =~  V2   0.769 0.034 22.524  0.000
3   f1 =~  V3   0.695 0.035 19.953  0.000
4   f2 =~  V4   0.609 0.044 13.699  0.000
5   f2 =~  V5   0.707 0.046 15.433  0.000
6   f2 =~  V6   0.604 0.044 13.596  0.000
7   V1 ~~  V1   0.540 0.048 11.351  0.000
8   V2 ~~  V2   0.409 0.052  7.802  0.000
9   V3 ~~  V3   0.517 0.048 10.682  0.000
10  V4 ~~  V4   0.629 0.054 11.613  0.000
11  V5 ~~  V5   0.501 0.065  7.737  0.000
12  V6 ~~  V6   0.635 0.054 11.843  0.000
13  f1 ~~  f1   1.000 0.000     NA     NA
14  f2 ~~  f2   1.000 0.000     NA     NA
15  f1 ~~  f2  -0.036 0.062 -0.585  0.559
> library(semTools)
> reliability(cfafit)                                                             # 计算AVE、CR(Composite Reliability)等值
              f1        f2     total
alpha  0.7566497 0.6727690 0.5629112
omega  0.7576777 0.6742191 0.7123837                                              # CR(Composite Reliability)
omega2 0.7576777 0.6742191 0.7123837
omega3 0.7576379 0.6741431 0.7072487
avevar 0.5110457 0.4093351 0.4621603                                              # AVE

