“用Jamovi进行多层回归分析”的版本间的差异
来自OBHRM百科
(→菜单操作) |
|||
| 第16行: | 第16行: | ||
8、得到结果。 | 8、得到结果。 | ||
| − | + | 9、根据需要勾选其他参数。</pre> | |
===操作步骤图解=== | ===操作步骤图解=== | ||
2020年4月1日 (三) 11:20的版本
菜单操作
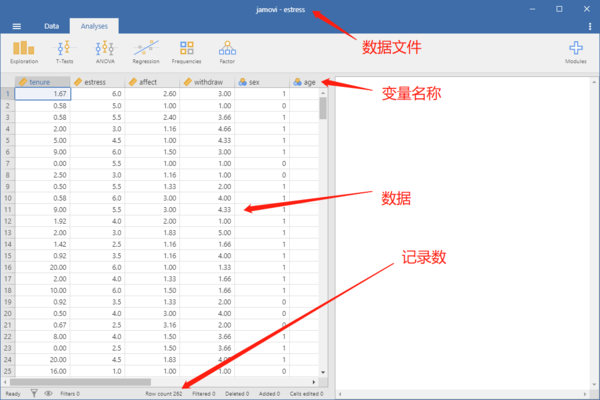
1、打开Jamovi与相应的数据文件。

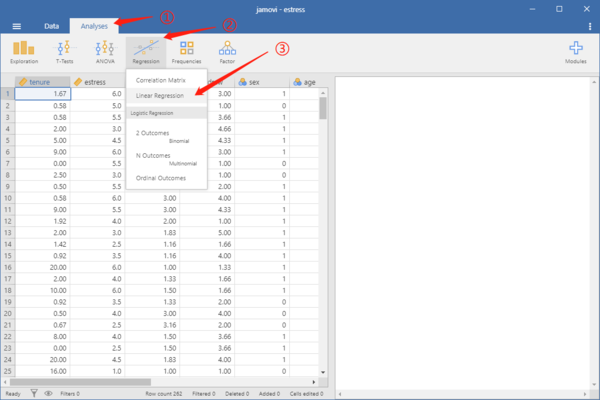
2、从Jamovi的菜单,依次选择:Analyses——Regression——Linear regression。

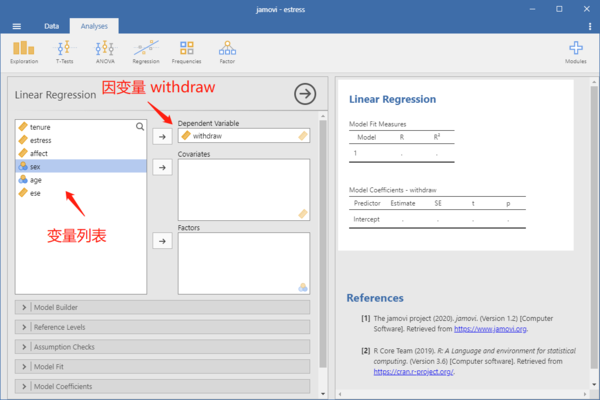
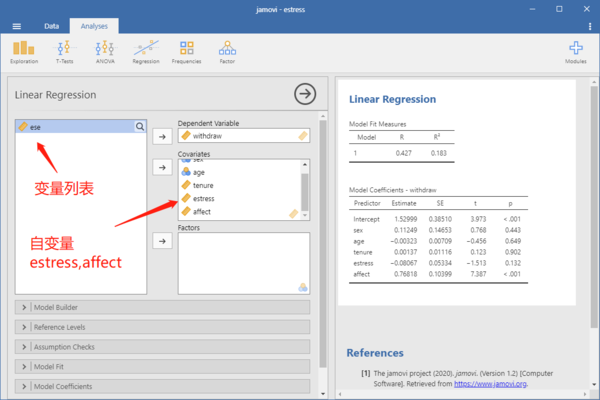
3、从左边的变量列表中,将因变量移到Dependent Variable下面。

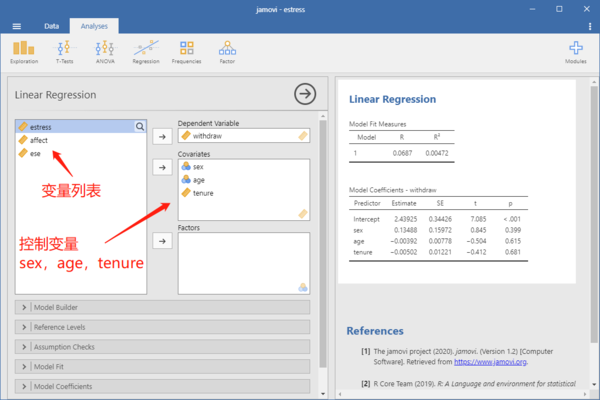
4、将多层回归中的控制变量移到Covariates下面。

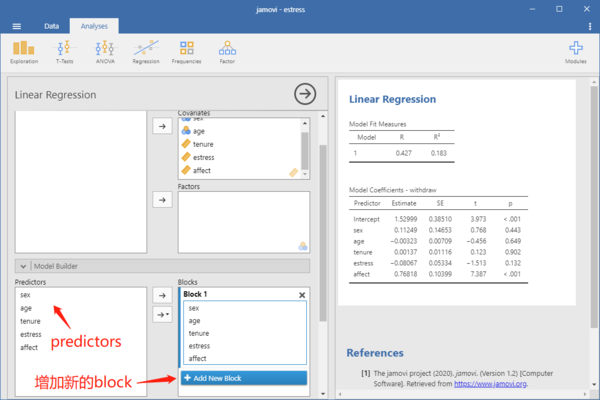
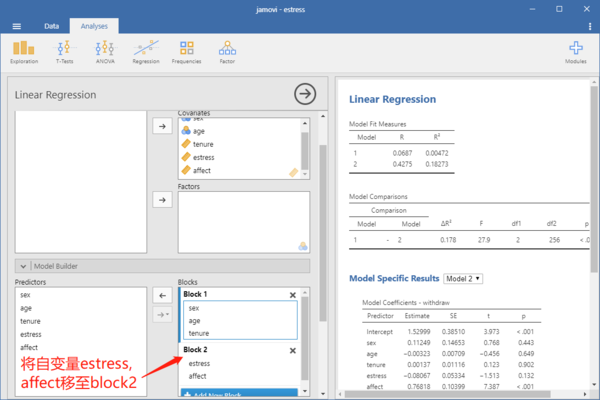
5、将多层回归中的自变量移到Covariates下面。这些自变量会自动出现在下面的Predictors下的方框中;在右边的Blocks下面设置好相应的Block,然后将Predictors下面方框中的变量,移动右边对应的Block下面。

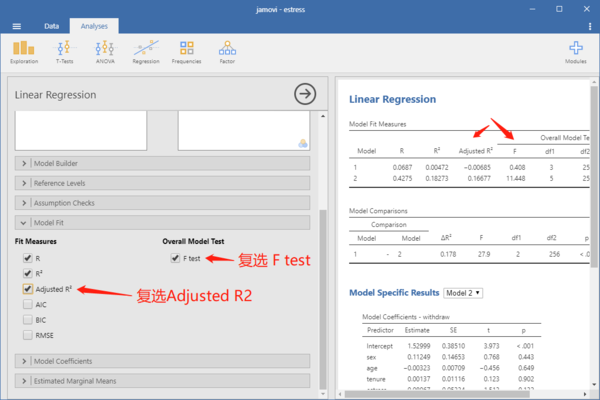
6、复选Fit Measures下面的:F test;Adjusted R2.

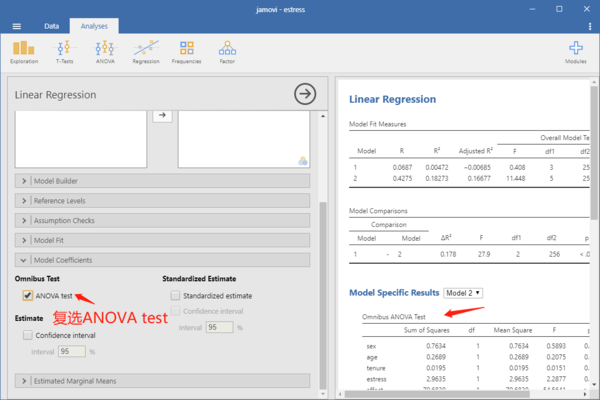
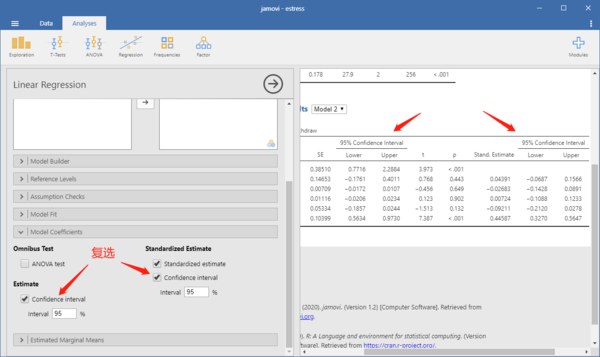
7、复选Model Coefficients下面的ANOVA test;如果需要复选Estimate下面的Confidence interval;复选Standardized Estimate下面的Standardized estimate,如果需要再复选Confidence interval。

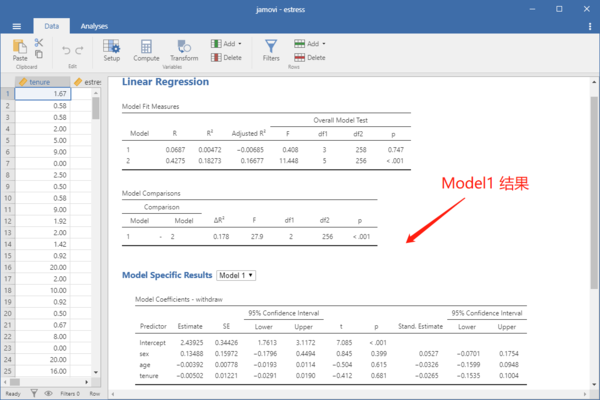
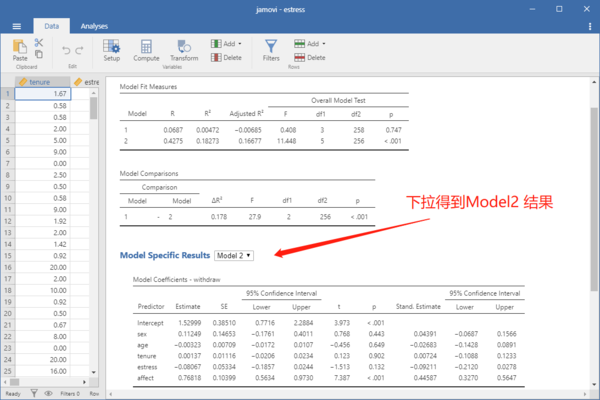
8、得到结果。

9、根据需要勾选其他参数。
操作步骤图解
1、打开Jamovi与相应的数据文件。
以Pollack等人(2012)“The moderating role of social ties on entrepreneurs’ depressed affect and withdrawal intentions in response to economic stress”中的数据为例,文章doi:10.1002/job.1794。原始数据下载:[[文件: ]]. 打开之后的界面如下:
2、从Jamovi的菜单,依次选择:Analyses——Regression——Linear regression。
3、从左边的变量列表中,将因变量移到Dependent Variable下面。
4、将多层回归中的控制变量移到Covariates下面。
5、将多层回归中的自变量移到Covariates下面。
这些自变量会自动出现在下面的Predictors下的方框中;在右边的Blocks下面设置好相应的Block,然后将Predictors下面方框中的变量,移动右边对应的Block下面。
6、复选Fit Measures下面的:F test;Adjusted R2.
7、复选Model Coefficients下面的ANOVA test;
如果需要复选Estimate下面的Confidence interval;复选Standardized Estimate下面的Standardized estimate,如果需要再复选Confidence interval。
8、得到结果。
9、根据需要勾选其他参数。
